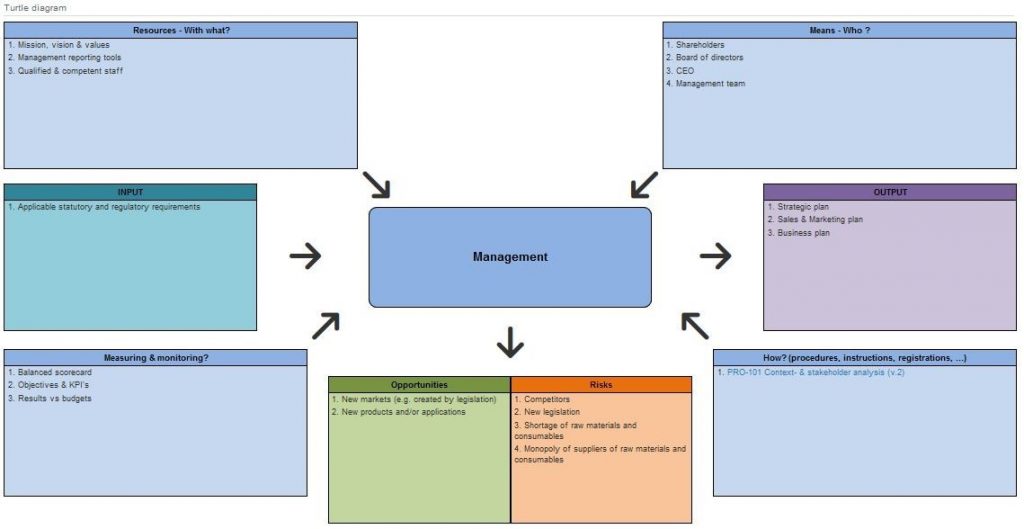
A turtle diagram is a technique to graphically display a process. This visual tool makes it easy to understand the processes. A process turtle diagram normally identifies inputs, outputs, resources, means, measuring and monitoring and ‘the how’.
Inputs includes internal and external customer requirements.
Outputs covers the process’s results:
- For a manufacturing process, the outputs include the finished product, statistical data, and other manufacturing-related records, as well as any scrap from the process.
- For a system process, this includes information, reports, or data.
- For any process, the actual output should represent the satisfaction of customer requirements.
Resources (or ‘with what?’) is all about the ‘nonhuman’ resources needed to perform the task.
Means (or ‘who?’) includes the ‘human’ resources needed to complete the process.
How provides insight into the operational controls required as described e.g. in procedures, instructions, …
Measuring & monitoring is a listing of the (key) performance indicators that will indicate the success or failure of the process.
However, you can broaden the scope. You could easily integrate the risks and opportunities to meet the requirements of the ISO standards, as visually represented in the figure below.